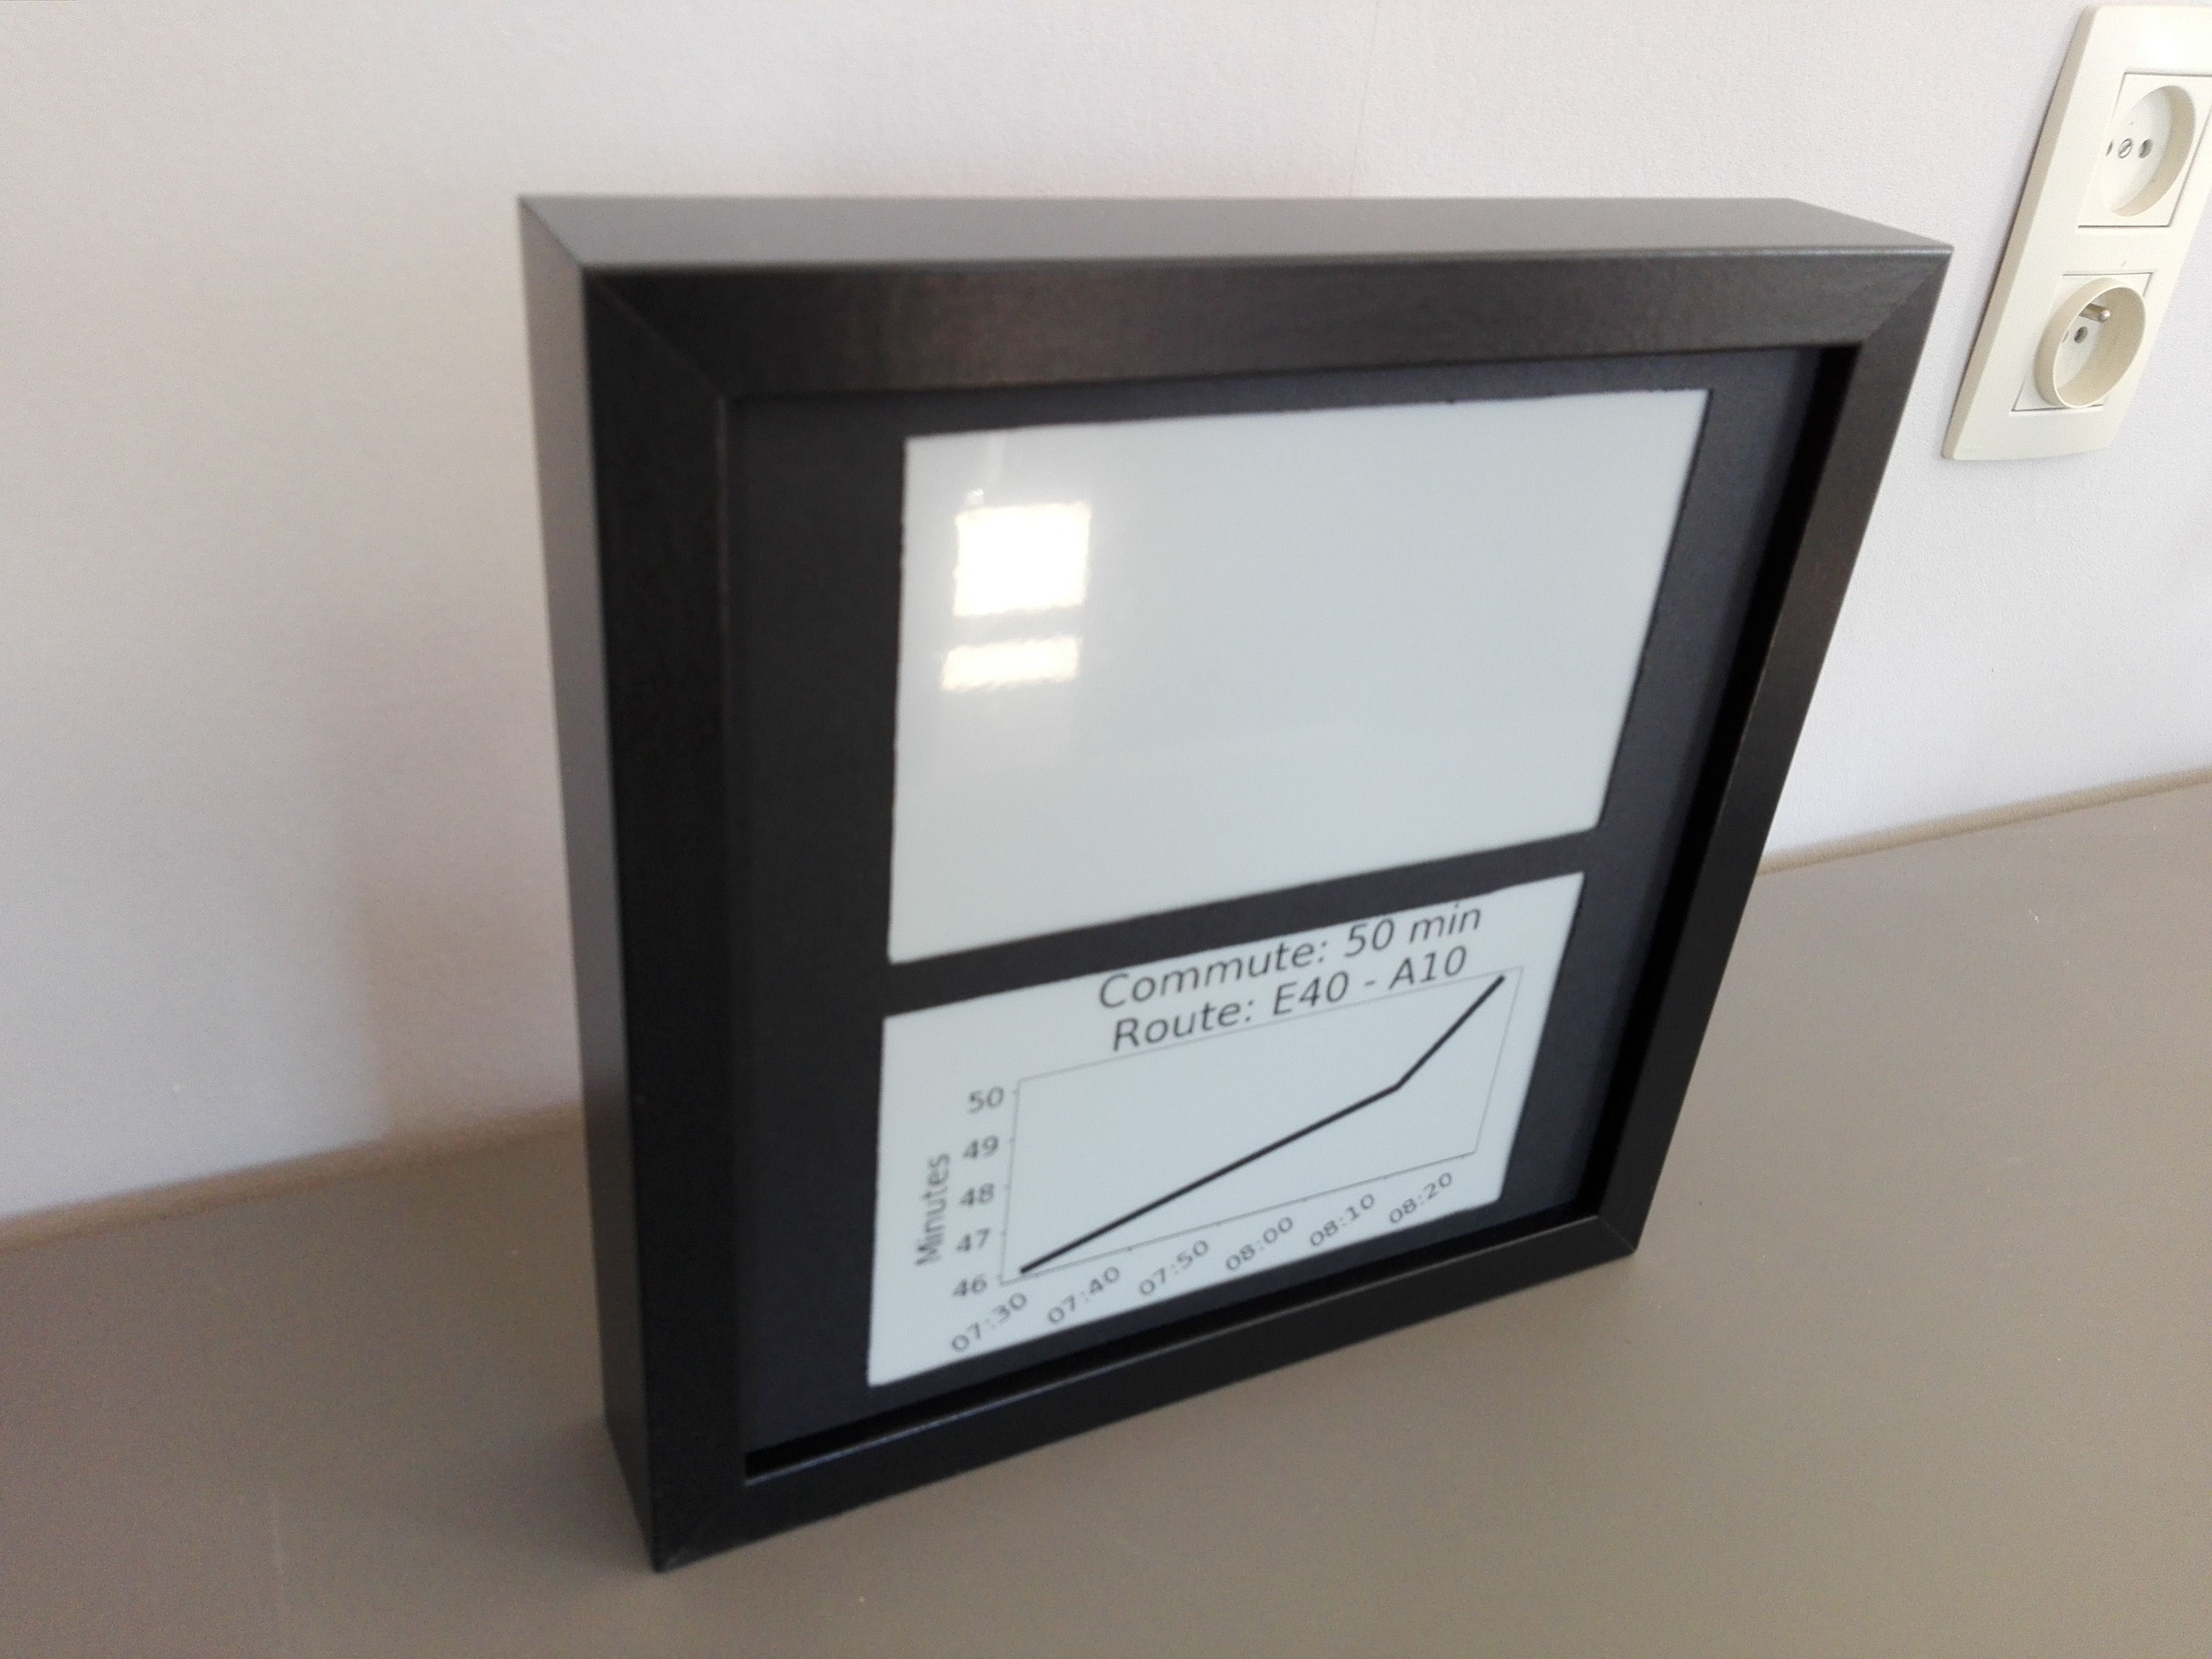
Double e-paper display used to display various information and pictures, integrated with Home Assistant
E-paper display linked with Home Assistant
I wanted a display which:
does not consume (a lot of) electricity
is linked with home-assistant, so I can get useful updates pending the moment of the day
can display interesting photos, when I don’t want to know the status of my house / surroundings :)
doesn’t cost an arm and a leg
The result of my tinkering can be seen in the picture above.
I’ve used two 7.5 inch e-paper displays and incorporated them into a picture frame. The reason for two dislays is mainly because larger e-papers just become very expensive. Obviously you don’t need two, if you don’t want to… .
1 - Display Intro
Concept
In the following posts, the different parts of the display are explained in more detail:
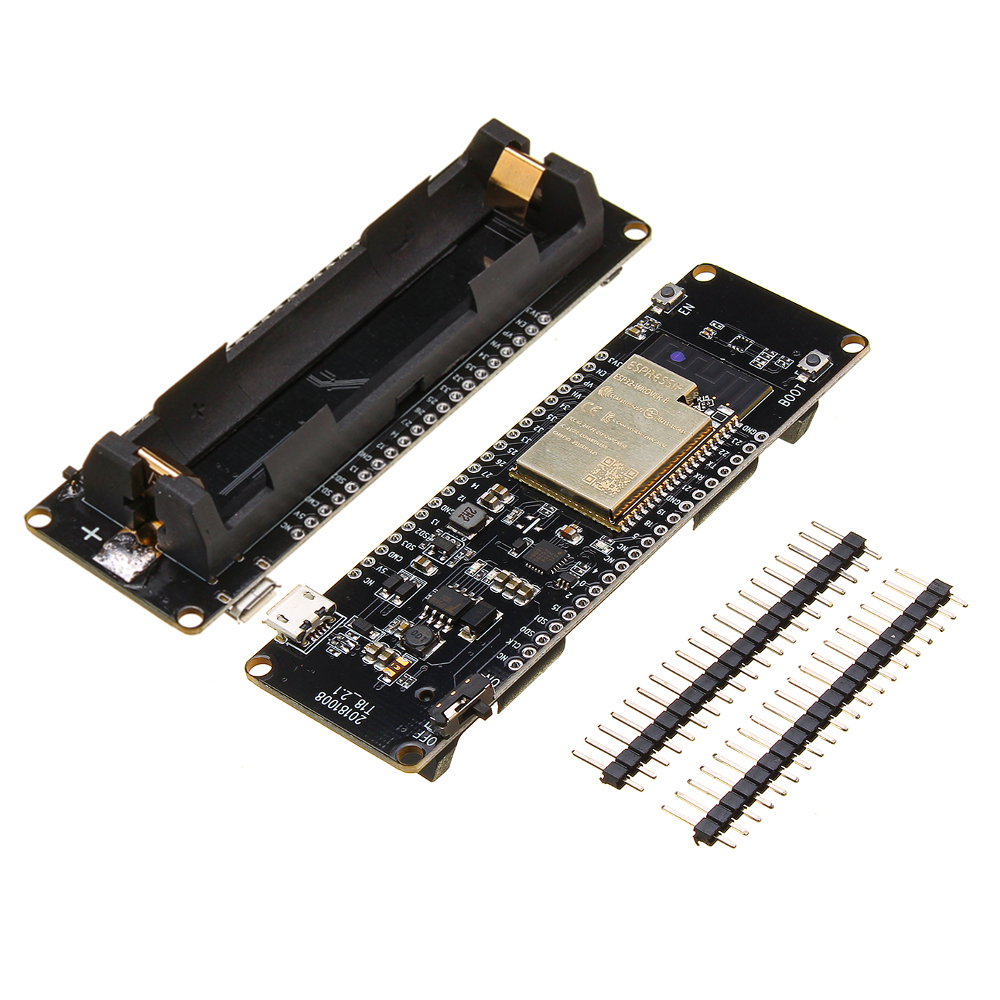
I should not have bought an ESP32 board including an 18650 battery: this types of batteries is barely available in Europe + if I want it battery operated I can just attach a powerbank, there is more than enough space in the picture frame.
add description of construction
2 - Concept
Intro
This part sketches the entire flow. I’ve changed my method a few times during the creation of this. Mainly because I just stumble upon things in the home assistant documentation, rather than actually finding something when I need it :).
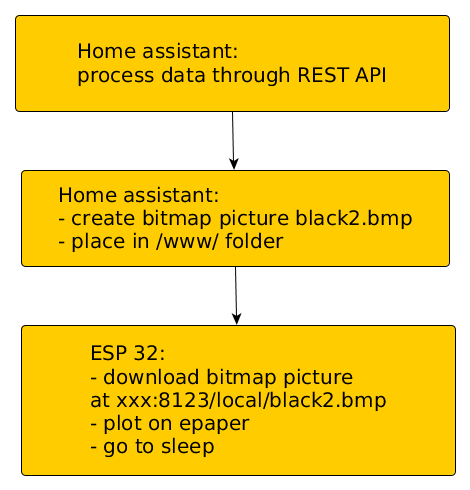
Different steps
Sequence to get home assistant content on e-paper
Relevant references to documentation (I want to find it back myself ;):
I’m using a debian version running home assistant (without docker etc.), I have not checked if anything should change when using hassio and other variants
the REST API, would allow to do everything on the esp32, but I didn’t go that route … .
3 - Actuate display using ESP32
Intro
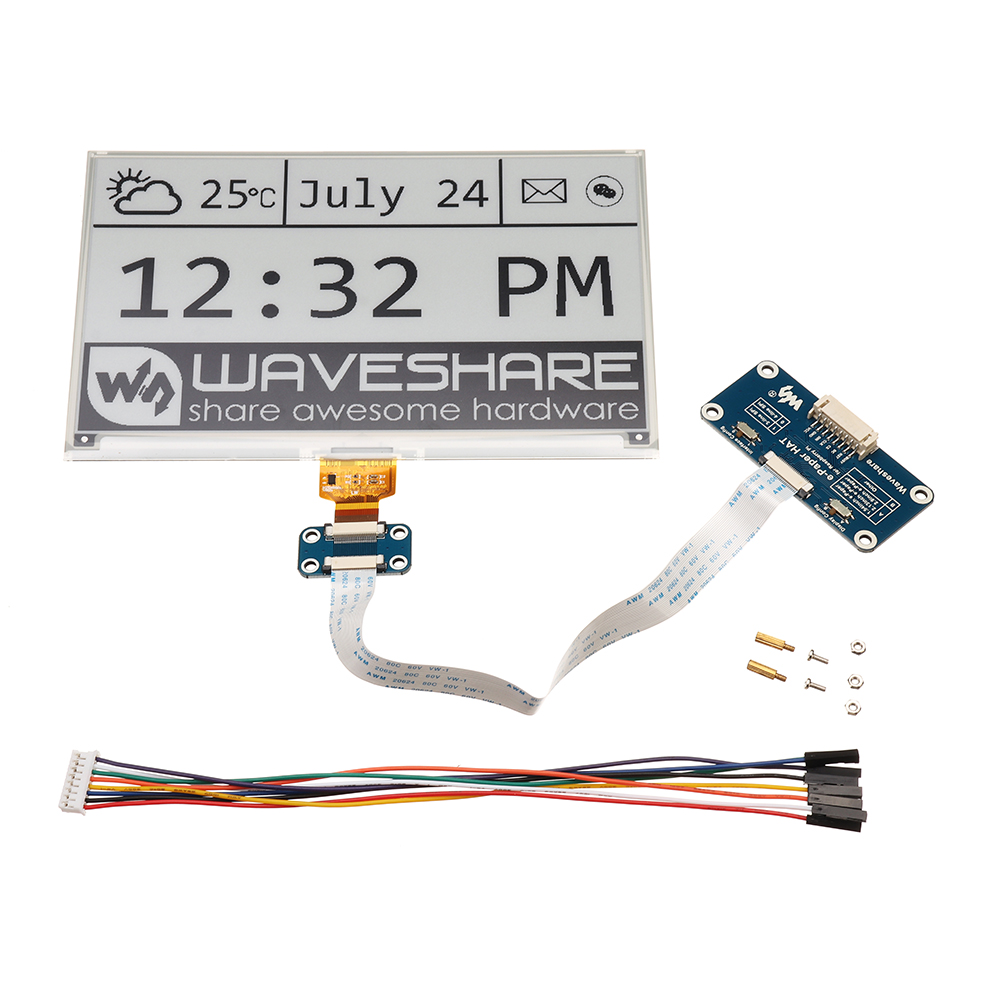
In this part, a figure, living on the Home Assistant server, will be displayed on a 7.5 inch e-paper using an ESP32-based board.
The SPI interface of the ESP32 will be used to control the display.
The pins of SPI quickly get confusing:
Names of the different interfaces of SPI aren’t very consistently used (MOSI, SPI D, SD0, SS, CS, SCK, CLK, SD1, … ) + you have to pay attention to the difference between IO pins and GPIO pins in the ESP32 datasheet.
The ports labeled on the ESP-board with clk, SD0, SD1, … are linked to an SPI bus. But one only used to flash the device, not used for communication with external devices … .
In the ESP32-wrover datasheet, it can be found two SPI busses are available for external communication: VSPI and HSPI.
Below, the overview is provided to which pins these two busses correspond with. The last column is mainly added to be able to check if custom esp32 boards (like this one) also respect the GPIO labels marked on the board. (The esp32 feet are still large enough to check with a multi-meter.)
VSPI
GPIO (pin label)
Name ESP32-wrover chip
No. ESP32 Chip
MOSI
23
VSPI D
37
MISO
19
VSPI Q
31
SCK
18
VSPI CLK
30
SS
5
VSPI CS
29
HSPI:
HSPI
GPIO (pin number board)
Name ESP32-wrover chip
No. ESP32 Chip
MOSI
13
HSPI D
16
MISO
12
HSPI Q
14
SCK
14
HSPI CLK
13
SS
15
HSPI CS
23
For the BUSY, reset and DC pin, any suitable DIO can be selected. This is how it looks in my configuration / script for VSPI:
static const uint8_t EPD_BUSY = 4;  // to EPD BUSY
static const uint8_t EPD_CS   = 5;  // to EPD CS
static const uint8_t EPD_RST  = 21; // to EPD RST
static const uint8_t EPD_DC   = 22; // to EPD DC
static const uint8_t EPD_SCK  = 18; // to EPD CLK
static const uint8_t EPD_MISO = 19; // Master-In Slave-Out not used, as no data from display
static const uint8_t EPD_MOSI = 23; // to EPD DIN
Esp 32: the code
The great GxEPD2 library will be used for drawing on the e-paper display.
A good example to verify if your pinout is correct and libraries are installed correctly, is to use this implementation: Weather display
For our purposes the default example in the library - GxEPD2_WiFi_Example.ino - will be modified to fit our purposes.
The main challenge was to make it download an image from a local website (home assistant at http://192.168.0.205:8123/local/black2.bmp ).
The resulting script can be found here, if you want to test it out:
A Credentials.h file is expected which contains your WiFi settings
Pay attention to set the SleepDuration, WakeupTime, SleepTime, … in the script when the system should remain awake
Of course, change 192.168.0.205:8123 to your own home assistant settings
Others
if you want to play around with displaying any image, I use ImageMagick to convert images to bitmaps consisting of 3D arrays (and not 4D) with the command:
This is the part to generate the content out of home assistant and display it on our e-paper.
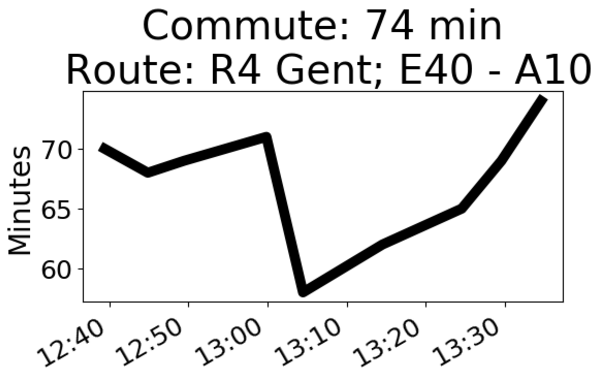
As an example I will display the expected commute time to work.
Python scripts being defined as a shell_command in configuration.yaml will be used. A simple automation to trigger the python script will be used.
Basis of script
We want to make a plot that tells us the expected time of our commute with a graph of the last hour, to see how the time is trending.
The component waze travel time, will be used to estimate our commuting time (with the name sensor.commute). Setting this up is not described in further detail.
You should create a www directory in your configuration folder
Note: To get the data out of home assistant, I’ve explored a few routes. Using hass-python script for interfacing with home assistant, scripts that would operate on home-assistant_v2.db, … until I’ve stumbled upon the Home Assistant: REST API. After this discovery, I don’t know why I should use anything else to capture data. Since this can be accessed from anywhere on the network (and makes debugging easy).
REST API
The documentation from the REST API, describes how to obtain a long term token. This needs to be filled in the hearders file (the xxx location).
#location where figure will be stored
path="/home/homeassistant/.homeassistant/www"
os.chdir(path)

# e-paper display size
width_displ=640
height_displ=384
dpi=100;

headers = {
    'Authorization': 'Bearer xxx,
    'content-type': 'application/json',
}
address_hass='192.168.0.205'
Getting timezones
All data gets stored with UTC timestamps. We want to convert our data to the local timezone.
Obtaining the timezone can be done by requesting the /api/config:
# get timezone to convert to local time, since database attributes are in UTC time
url='http://'+address_hass+':8123/api/config'
response = get(url, headers=headers)
temp=response.text
readable_json=json.loads(temp)
time_zone=readable_json['time_zone']
tz = timezone(time_zone)
Get sensor history
Here the data from our sensor will be obtained, by default the history of 1 day is provided. The data will be stored in numpy arrays and will be immediately converted to the local timezone.
entity_id='sensor.commute'

# this downloads history of the last day
url='http://'+address_hass+':8123/api/history/period'+'?filter_entity_id='+entity_id

response = get(url, headers=headers)
temp=response.text
temp=temp[1:len(temp)-1]
readable_json=json.loads(temp)

time_array= np.array([])
state_array=np.array([])
for i in readable_json:
    time_update=datetime.strptime(i['last_updated'],'%Y-%m-%dT%H:%M:%S.%f%z')
    time_array=np.append(time_array, time_update.astimezone(tz))
    state_array=np.append(state_array,float(i['state']))
Create bitmap file
At last, a plot from the data within the last hour will be created,
the x-axis will be plotted containing hours and minutes
# only plot data from last hour
time_treshold=time_array[-1]-timedelta(hours=1)
idx=time_array>time_treshold

last_info=readable_json[-1]
last_attr=last_info['attributes']

fig=plt.figure(num=None, figsize=(int(width_displ/dpi), int(height_displ/dpi)), dpi=dpi, facecolor='w', edgecolor='k')

plt.plot(time_array[idx],state_array[idx],linewidth=7.0,c='k')
plt.ylabel('Minutes',fontsize=20)
plt.xticks(fontsize=18)
plt.yticks(fontsize=18)
ax = plt.gca()
ax.yaxis.set_major_formatter(FormatStrFormatter('%.0f'))

plt.title('Commute: '+format(state_array[-1],'.0f')+' min'+'\n '+'Route: '+last_attr['route'],fontsize=28)

xformatter = DateFormatter('%H:%M')
plt.gcf().axes[0].xaxis.set_major_formatter(xformatter)
plt.gcf().autofmt_xdate()

fig.savefig('plot.png',bbox_inches='tight',dpi=dpi)
Example, generated figure:
Example bitmap
Testing the python script
ssh to the home assistant server (raspberry pi)
sudo su -s /bin/bash homeassistant
cd /home/homeassistant/.homeassistant/python_scripts/
python3 db_plotter.py
As a next step we will add options to the python script, so we can command different options through automations in home assistant.
# check if passed options are valid
try:
    options, args = getopt.getopt(sys.argv[1:], 's:',['selection='])
    # print(options)
    # print(args)
except getopt.GetoptError:
    print("incorrect syntax")
    print("usage: python3 db_plotter.py -s <value>")
    print("default to option 1")
    display_option=1
    sys.exit(2)
for opt, value in options:
    if opt in ('-s','-S','--selection'):
        display_option=int(value)
        print("successful argument")
        print(display_option)
The whole script, created above will be moved to an if-else construction
if display_option==2:
    entity_id='sensor.commute'
    ....
Now we need to test the script by running: python3 db_plotter.py -s 2.0
Configuration.yaml
Define the script as a shell command with the option to give different arguments with it, contained in a dummy variable (dummy_epaper).
In this part, the esp32 software will be extended to control two displays.
The described solution mainly comes because of the great support from the creator of gxEPD2, so credits to him.
Hardware struggles
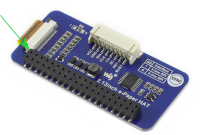
The used 7.5 inch display, comes with an e-Paper Driver HAT.
When connecting it as intended - 3.3V of this ESP32 connected to the 3.3 V of the e-paper HAT - it turns out very unreliable.
It becomes more unreliable when combining more than one e-paper to the display (or it can be my cognitive bias).
The solution is to bypass the voltage converter and directly connect the 3.3V from the ESP32 according the picture below (see scematics):
Alternative 3.3V connection
Software ESP32
SPI
One common SPI is used for both displays; the busy, reset and CS pin are separate pins for each display.
(Using two different SPI’s for both displays, was too much work to make it work.)
#define ENABLE_GxEPD2_GFX 1
#include <GxEPD2_BW.h>

//SPI pins, common for both displays
static const uint8_t EPD_DC   = 22; // to EPD DC
static const uint8_t EPD_SCK  = 18; // to EPD CLK
static const uint8_t EPD_MISO = 19; // Master-In Slave-Out not used, as no data from display
static const uint8_t EPD_MOSI = 23; // to EPD DIN

// display two:
static const uint8_t EPD_BUSY2 = 4;  // to EPD BUSY
static const uint8_t EPD_CS2   = 5;  // to EPD CS
static const uint8_t EPD_RST2  = 21; // to EPD RST
GxEPD2_BW<GxEPD2_750, GxEPD2_750::HEIGHT> display2(GxEPD2_750(/*CS=*/ EPD_CS2, /*DC=*/ EPD_DC, /*RST=*/ EPD_RST2, /*BUSY=*/ EPD_BUSY2));   // B/W display

//display one:
static const uint8_t EPD_BUSY1 = 25;  // to EPD BUSY
static const uint8_t EPD_RST1  = 34; // to EPD RST
static const uint8_t EPD_CS1   = 15;  // to EPD CS
GxEPD2_BW<GxEPD2_750, GxEPD2_750::HEIGHT> display1(GxEPD2_750(/*CS=*/ EPD_CS1, /*DC=*/ EPD_DC, /*RST=*/ EPD_RST1, /*BUSY=*/ EPD_BUSY1));   // B/W display
Displaying
Two images are downloaded now, one for each display: black1.bmp and black2.bmp